 Skip to main content

Lipids 1
QUANTIFYING LC-PUFA IN FISH OIL CONCENTRATES AND ALGAL OILS – CHOOSING THE CORRECT METHOD
Prepared by Dr. Charlie Scrimgeour & Claire Traynor, June 2017

Fish oil concentrates and algal oils rich in LC-PUFA are increasingly available in the speciality oil market. Accurate analysis of LC-PUFA is required for production control, labeling claims and trading standard tests. It is important that the most appropriate analytical method is used with such materials to ensure compliance with specifications, label claims and customer requirements.
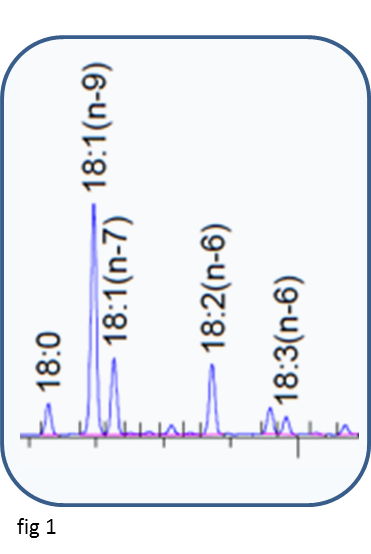
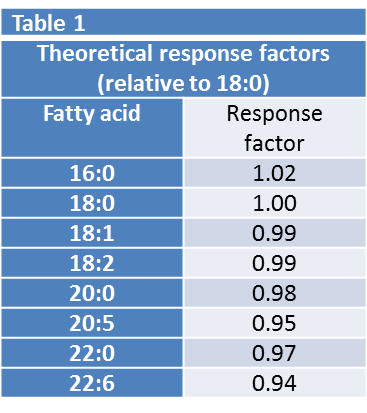
The primary result from a GC analysis of a fatty acid methyl ester mixture is a trace of detector response against time (fig 1), from which the fatty acids can be identified and quantified. The normalised detector response is often referred to as the area % of the individual fatty acids. Since the flame ionisation detector responds to the amount of carbon eluting from the GC column over a wide dynamic range, the area% is close to the weight% of fatty acids in the mixture. The weight% can be accurately calculated using theoretical response factors based on the empirical formula of the individual fatty acids. For the range of chain-length and unsaturation found in most plant oils this small correction (Table 1) is all that is required to obtain reliable weight% results.
Note - the weight%, as described above, is the amount of each fatty acid in the fatty acid profile, NOT its absolute amount in the sample
The absolute amount may be less than the area% because:
The sample rarely comprises only fatty acids – most oils are triacylglycerols which contain ~4% glycerol.
Minor components such as tocopherols and sterols are present.
Oxidation or other degradation has occurred.
The oil may be only part of the formulation.
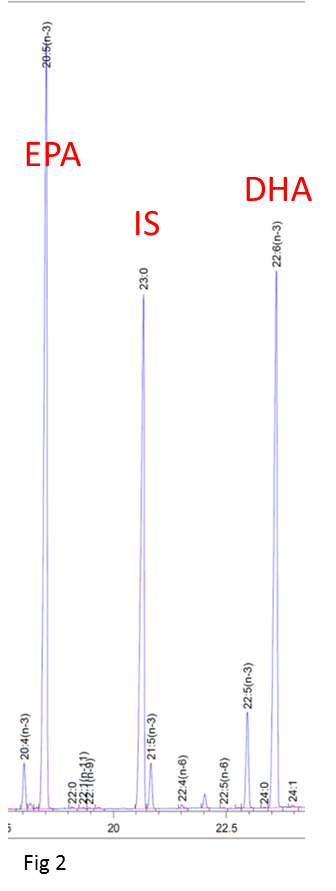
To measure absolute amounts, the detector response has to be calibrated against a known amount of standard. Odd chain-length fatty acids are rare in nature and can be used as internal standards, added at the start of the analysis and subject to the same extraction and derivatisation procedures as the sample. 17:0 is used for plant oils and 23:0 for samples with a wider range of chain lengths such as fish oils (Fig 2).
For example, the commonly used method AOCS Ce 1b-89, uses 1 mg 23:0 as internal standard in a 25 mg sample. The theoretical response factors are then used to obtain the weight% for the sample plus standard and hence the absolute amounts of each fatty acid, usually expressed as mg/g. AOCS Ce 1b-89 was developed for the analysis of fish oils which seldom have >20% of either EPA or DHA. Fish oil concentrates and algal oils with >30% EPA and/or DHA are now widely available and the accuracy of this method has been questioned for such samples. The weakness of AOCS Ce 1b-89 is its reliance on theoretical response factors for the highly unsaturated long chain polyenes.
The alternative method EP 2.4.29, developed particularly for concentrates, uses measured response factors for EPA and DHA relative to 23:0 and also requires a number of system suitability tests to ensure that GC and column performance is adequate. 60 to 90 mg amounts of high purity methyl 23:0, ethyl EPA and ethyl DHA are required for each calibration and analysis. In consequence, the EP method is more expensive and time consuming to perform.
According to their 2015 ver. 5 Voluntary Monograph and associated Technical Guidance Document the GOED recommended method for analysis of fish oils and fish oil concentrates is based on the EP 2.4.29 method.
System suitability
Detector response – theoretical and measured response factors for a gravimetric mixture of 16:0 to 22:0 saturated standards must agree within set limits.
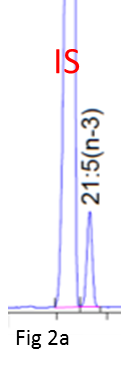
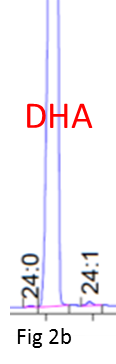
Column resolution – there must be adequate resolution between 23:0 and any 21:5(n-3) present (Fig 2a) and between DHA and 24:1 (Fig 2b).
Response factors
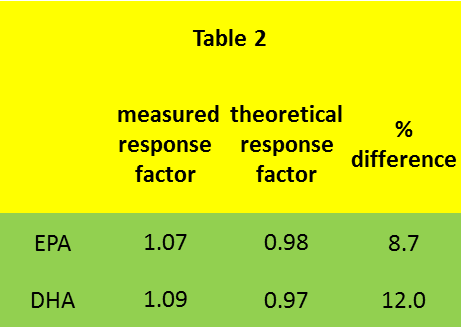
Measured response factors for a typical test mixture (Table 2) are of the order of 10% lower than theoretical values. There is significant day to day variation in the response factors, requiring them to be checked with each batch of samples.
Comparison of methods
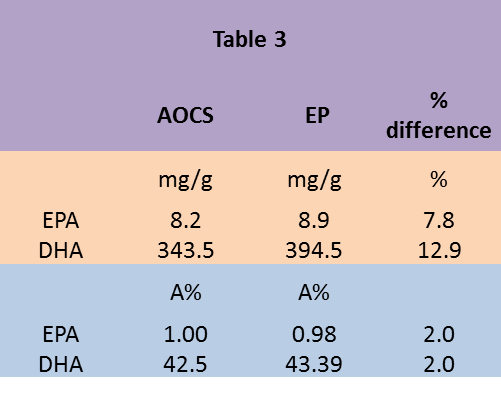
Results for a sample analysed by both methods (Table 3) show that the absolute amounts (mg/g) are around 10% higher for the EP method. Area% results are similar for both methods. The difference in mg/g results closely reflects the difference between theoretical and measured response factors.
Conclusion
Method EP 2.4.29 is strongly recommended for samples expected to contain 30% or more of EPA and DHA combined. Method AOCS Ce 1b-89 gives consistently low results for these samples due to its reliance on theoretical response factors.